Paraview 3.12 on 64-bit CentOS 5.7
I finally got around to installing Paraview on my CentOS 5 box. There are no official RPMS for CentOS 5, so I was expecting a painful build process. To my great surprise, I was able to download the Paraview binary for Linux (64-bit) from Kitware, unpack the archive, and run it! As root, I placed the entire ParaView-3.12.0 directory under /opt/Paraview. You could also keep it in your home directory if you are running a single-user system. I added /opt/Paraview/ParaView-3.12.0/bin to the $PATH in the .bashrc file in my home directory. Now I can type paraview at the command line and it runs! What if you want Paraview to appear in the Applications menu in your desktop environment? Most modern desktops (I use XFCE4) construct the Applications menu “on the fly” based upon the files in a standard directory (/usr/share/applications on CentOS). The Free Desktop Project has created a standard for desktop entry files. You may also find this summary of the standard to be helpful. To add Paraview to the menu, you simply need to create a new file in the standard location. If you installed Paraview in your user directory, you may want to place the desktop file in $HOME/.local/applications. Here are the contents of a file I called paraview.desktop:
Installing Sage 4.7 on CentOS 5
I recently upgraded my desktop workstation from an old 32-bit version of Gentoo to 64-bit CentOS 5. I downloaded and installed the latest version of Sage, and the process went smoothly. If you find this post helpful, please check out the Sage Beginner’s Guide at Packt Publishing. Since I don’t use Sage every day, I actually refer to my own book on a regular basis!
Download
Since CentOS is designed to be binary compatible with Red Hat Enterprise Linux, the correct binary to download is sage-4.7.2-linux-64bit-red_hat_enterprise_linux_server_release_5.6_tikanga-x86_64-Linux.tar.gz
Python string format examples
The format method for Python strings (introduced in 2.6) is very flexible and powerful. It’s also easy to use, but the documentation is not very clear. It all makes sense with a few examples. I’ll add more as I have time:


Formatting Numbers in Python Strings
Formatting a floating-point number
[code language=“python”] “{0:.4f}".format(0.1234567890) “{0:.4f}".format(10.1234567890) [/code] The result is the following string:
'0.1235'
'10.1235'
Braces { } are used to enclose the “replacement field” 0 indicates the first argument to method format : indicates the start of the format specifier .4 indicates four decimal places f indicates a floating-point number
How to build ScipPy with Python 2.7.2 on CentOS5
EDIT: added –enable-shared to configure script for building Python, and added /home/yourname/lib to shared library path. This is necessary for building some packages such as pycairo (which you may need to build pygtk and matplotlib). EDIT 2: you should use the –prefix=/home/yourusername instead of –user. The prefix option places packages in the standard location: /home/yourusername/lib/python2.7/site-packages. The –user option places the packages in /home/yourusername/.local/lib/python2.7/site-packages which I think is screwed up! I use CentoOS5 because I want enterprise-class stability, as well as binary compatibility with a commercial application that is built for RHEL5. I need to use some “bleeding edge” packages, such as the latest version of SciPy, but I don’t want to affect the base stability of the system. Here is how I did it. First, with superuser privileges, use yum to install the following packages. You may need to set up epel as an alternate repository:
Removing an axis or both axes from a matplotlib plot
Sometimes, the frame around a matplotlib plot can detract from the information you are trying to convey. How do you remove the frame, ticks, or axes from a matplotlib plot? matplotlib plot without a y axis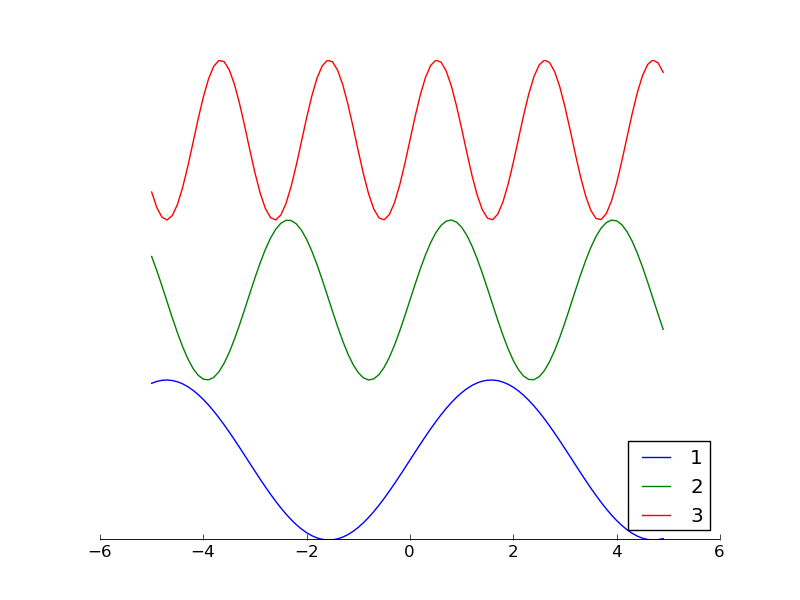
Some books you may find useful when working with matplotlib:


The full example is available on github.
First, we construct a figure and an axes object:
fig1 = plt.figure(facecolor='white')
ax1 = plt.axes(frameon=False)
The Axes object is a container that holds the axes, the ticks, the labels, the plot, the legend, etc. You will always have an Axes object, even if the axes are not visible! The keyword argument frameon=False turns the frame off. An alternative method is:
Finding dimensions of a bounding box in Jmol
The Jmol applet (or Java application) is widely used to visualize the structure of molecules. It is very powerful, but not that well documented. If you don’t have Jmol running, open the page for Glucose Oxidase (1CF3) from the Protein Databank so you can follow the instructions for finding the size of the bounding box. Right-click on the applet to get a pop-up menu with lots of options. Under the Stylesubmenu, click onBoundboxto show a bounding box around the molecule: Show bounding box
A self-contained Fortran linear equation solver
I’ve just released a self-contained Fortran module that solves a system of linear equations using the LU decomposition. Download the Fortran linear solver from github This module is based on code that was implemented and released on the Web by Jean-Pierre Moreau. His implementation was based on one of the Numerical Recipes books. I updated his code to a more strict Fortran 90 standard and added the necessary comments so that it can be built as a Python module using f2py. I replaced Jean-Pierre’s Fortran test program with a simpler, self-contained program. I also included a Python script that implements the same test case. I created this module because sometimes a self-contained routine is more appropriate than a full library. I am compiling a library that implements a custom boundary condition for a proprietary computational fluid dynamics solver (CFD-ACE+). The library has to be written in Fortran, and it has to be built using a proprietary set of build scripts. I could either try to reverse-engineer the build process and to modify it to link to a shared library like LAPACK, or I could implement a self-contained solver. Since Pierre had already implemented the solver, I was able to slightly modify his code and get it working relatively quickly.
Finding a value in an unordered Fortran array
I have been optimizing some Fortran code that involved searching for an integer value in an unordered array (we know the value occurs only once). Since there is no intrinsic procedure to accomplish this, I thought I’d try a couple of approaches to see which was fastest. The simple answer is that, in this case, brute force beats elegance, even when the target value is near the end of the array. Download the full example from GitHub
Sage: open-source mathematical software
I’ve recently gained a lot of experience with Sage, an open-source alternative to MATLAB, Mathematica, Maple, MuPAD, and Magma. Here are a couple of links to check out:
Public notebook servers--try it online right now! Interactive examples with Sage
Sage vs. Mathematica
My experience with mathematical software started my freshman year at the University of Illinois when I signed up for a calculus class that was taught almost entirely with Mathematica. I grew to love Mathematica’s symbolic computation and plotting capabilities, although I found its programming language to be cumbersome. Once I was no longer a student, Mathematica was no longer an option due to the hefty licensing fees. With the caveat that I haven’t used Mathematica in many years, I will say that Sage compares very favorably to my experience with Mathematica. Sage has a notebook interface that allows you to integrate code, results, text, typeset equations, and graphics in an interactive document that can be viewed with any standards-compliant web browser. I don’t know how Sage stacks up against Mathematica in areas of advanced mathematics. I have heard that Sage is far ahead of Mathematica in number theory, because the lead developer of Sage is a number theorist.