shocksolution.com
read more
Removing an axis or both axes from a matplotlib plot
Sometimes, the frame around a matplotlib plot can detract from the information you are trying to convey. How do you remove the frame, ticks, or axes from a matplotlib plot? matplotlib plot without a y axis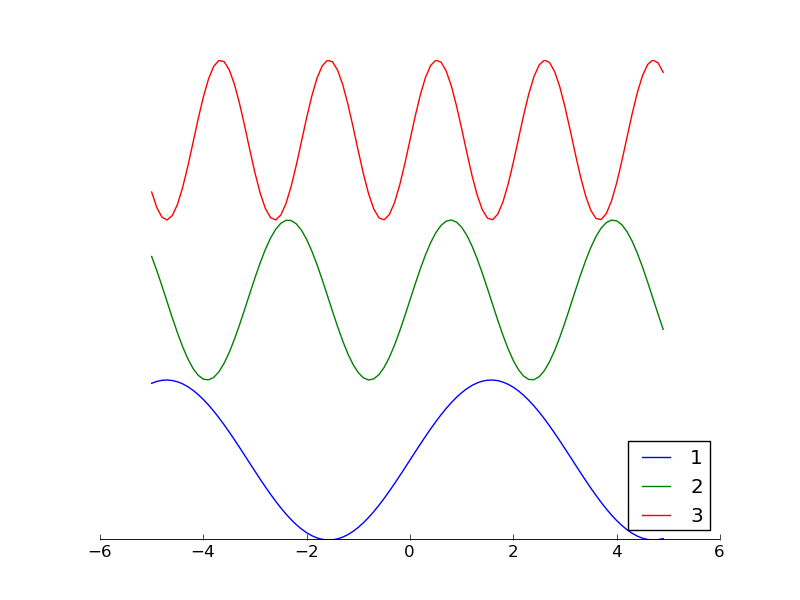
Some books you may find useful when working with matplotlib:


The full example is available on github.
First, we construct a figure and an axes object:
fig1 = plt.figure(facecolor='white')
ax1 = plt.axes(frameon=False)
The Axes object is a container that holds the axes, the ticks, the labels, the plot, the legend, etc. You will always have an Axes object, even if the axes are not visible! The keyword argument frameon=False turns the frame off. An alternative method is: